Spectrometer Market Growth: $16.5 Billion Global Surge by 2025 with Key Insights from the U.S., China, and Japan
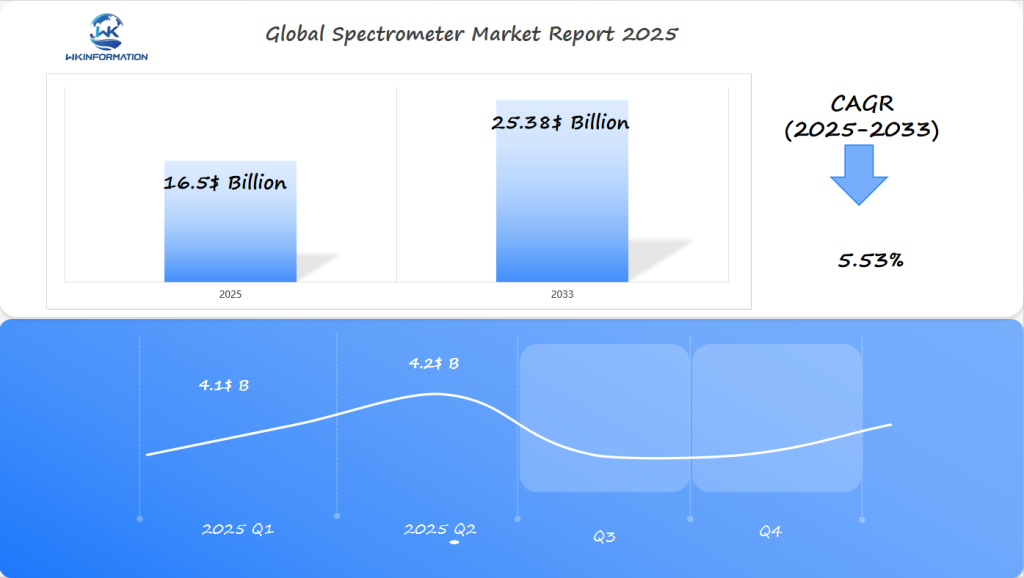
Explore the comprehensive analysis of the Global Spectrometer Market (2025-2033), including market trends, key players, technological advancements, and growth projections. This report examines the market’s expansion from USD 16.5 billion in 2025 to USD 25.38 billion by 2033, with detailed insights into industry applications, regional dynamics, and emerging technologies shaping the future of spectrometry.
- Last Updated:
Spectrometer Market Q1 and Q2 2025 Forecast
The Spectrometer market is projected to reach $16.5 billion in 2025, with a CAGR of 5.53% from 2025 to 2033. In Q1 2025, the market will likely generate approximately $4.1 billion, driven by continued advancements in analytical techniques and research & development activities in the U.S., China, and Japan. Spectrometers are in high demand across sectors such as pharmaceuticals, biotechnology, chemicals, and environmental monitoring.
By Q2 2025, the market is expected to reach $4.2 billion, spurred by the growing importance of precision analysis in material testing, quality control, and research. The U.S. market will benefit from high investments in scientific research, while China and Japan continue to drive demand for spectroscopy technologies in manufacturing, healthcare, and environmental analysis.
The market will be positively impacted by the growing adoption of portable spectrometers in field applications and continued innovations in the field of infrared and mass spectrometry.
Analyzing the Upstream and Downstream Flow in the Spectrometer Market
The spectrometer market’s supply chain reveals a complex network of interdependent components and stakeholders. Understanding these dynamics helps identify growth opportunities and potential bottlenecks in the industry.
Upstream Analysis
The upstream segment of the spectrometer supply chain includes:
- Raw Material Suppliers
- Optical components (prisms, gratings)
- Electronic components
- Specialized glass and crystal materials
- Metal housings and chassis
- Manufacturing Capabilities
- Precision engineering facilities
- Clean room environments
- Quality control systems
- Assembly lines for different spectrometer types
Downstream Impact
The downstream flow directly affects various industries:
- Pharmaceutical Applications
- Drug development and testing
- Quality control processes
- Research and development
- Clinical trials
- Environmental Testing
- Water quality analysis
- Air pollution monitoring
- Soil contamination studies
- Additional End-Users
- Academic research institutions
- Food safety testing labs
- Chemical manufacturing
- Semiconductor industry
Supply chain disruptions in raw material procurement can create significant ripple effects throughout the market. A shortage of specialized optical components can delay production schedules, affecting delivery times to end-users. These delays impact critical research projects and quality control processes across industries.
The increasing demand for customized spectrometers has created new challenges in supply chain management. Manufacturers must maintain flexible production capabilities while ensuring consistent quality standards. This balance requires sophisticated inventory management systems and strong relationships with reliable suppliers.
Trends Driving Innovation in the Spectrometer Industry
The spectrometer industry has seen significant technological advancements, turning traditional methods of analysis into complex, highly accurate tools. Mass spectrometry techniques now achieve unprecedented accuracy through advanced ionization methods and hybrid instruments that combine multiple detection capabilities.
1. AI-Powered Precision
Artificial intelligence (AI) is revolutionizing the way spectrometers operate, bringing about a new level of precision and efficiency. Here are some key areas where AI is making an impact:
- Real-time data analysis capabilities through machine learning algorithms
- Automated calibration and error detection systems
- Pattern recognition for complex sample identification
- Predictive maintenance scheduling to minimize downtime
2. Miniaturization Revolution
The development of portable spectrometers has created new market opportunities:
- Hand-held devices for field testing and remote analysis
- Smartphone-compatible spectroscopic sensors
- Micro-spectrometers for IoT integration
- Lab-on-chip solutions for point-of-care diagnostics
3. Recent Technical Innovations
Some recent technical innovations in the spectrometer industry include:
- High-resolution imaging mass spectrometry for tissue analysis
- Quantum cascade laser-based systems for enhanced sensitivity
- Multi-modal spectroscopy platforms combining different analytical techniques
- Cloud-connected spectrometers enabling remote monitoring and control
These advancements have sparked new applications across various sectors. Research facilities now utilize AI-enhanced spectrometers for drug discovery, while environmental agencies deploy portable units for on-site contamination analysis. The integration of smart features has reduced analysis time from hours to minutes, enabling higher throughput and improved accuracy in quality control processes.
The rise of smart manufacturing has pushed spectrometer manufacturers to develop Industry 4.0-compatible instruments. These systems feature advanced connectivity options, allowing seamless integration with existing production line monitoring systems and enterprise-wide data management platforms.
Challenges and Barriers Affecting the Spectrometer Market
The spectrometer market faces significant hurdles despite its promising growth trajectory. High competition among manufacturers has created intense pricing pressures, forcing companies to balance quality with cost-effectiveness. Leading players like Thermo Fisher Scientific and Agilent Technologies engage in aggressive pricing strategies, making it difficult for smaller manufacturers to maintain profitable margins.
Key Market Challenges:
- Initial investment costs remain prohibitively high for many potential buyers
- Complex maintenance requirements demand specialized technical expertise
- Limited availability of skilled operators in emerging markets
- Supply chain disruptions affecting component availability
- Price sensitivity in academic and research sectors
Regulatory Landscape Complexities
Different regions present varying regulatory requirements, creating compliance challenges for manufacturers:
- United States: FDA regulations demand strict validation protocols for spectrometers used in pharmaceutical testing
- European Union: REACH and RoHS compliance requirements affect manufacturing processes
- Asia-Pacific: Diverse regulatory standards across countries create market entry barriers
Quality control standards pose additional challenges, particularly in:
- Method validation requirements
- Documentation procedures
- Performance qualification protocols
- Calibration specifications
The standardization of spectrometer measurements across different manufacturers remains a persistent challenge. Users often face difficulties when comparing results obtained from different instruments, leading to potential inconsistencies in research and industrial applications.
Market fragmentation presents another significant barrier, with specialized instruments required for specific applications. This specialization necessitates maintaining diverse product lines, increasing manufacturing costs and complexity for producers.

Geopolitical Factors Impacting Spectrometer Supply and Demand
The spectrometer market is currently facing significant disruptions due to ongoing geopolitical tensions. Trade disputes between major economies have a cascading effect on the supply chain, impacting both manufacturers and end-users.
1. U.S.-China Trade Relations
- 25% tariffs on Chinese-made scientific instruments
- Increased costs for U.S. laboratories purchasing Chinese components
- Restricted access to rare earth elements essential for spectrometer production
2. Supply Chain Vulnerabilities
- Semiconductor shortages affecting electronic components
- Limited access to specialized materials from specific regions
- Increased lead times for equipment delivery
- Disrupted logistics networks
3. Regional Manufacturing Shifts
- Companies relocating production facilities to avoid tariffs
- Development of alternative supply sources
- Investment in local manufacturing capabilities
- Creation of regional supply chain hubs
4. Policy Impact on Distribution
- Export control regulations affecting high-tech equipment
- Import restrictions on sensitive technologies
- Compliance requirements for cross-border shipments
- Documentation and certification challenges
5. Market Response Strategies
- Diversification of supplier networks
- Investment in domestic production capabilities
- Strategic partnerships with local manufacturers
- Development of alternative material sources
Recent sanctions and export controls have particularly affected the distribution of advanced spectrometry equipment to certain markets. Companies now implement strategic stockpiling of critical components and develop alternative supply routes to maintain production schedules.
The establishment of new trade agreements between various regions creates opportunities for market expansion. Countries with strong diplomatic ties often benefit from preferential trade terms, influencing the competitive landscape of the spectrometer industry.
Market Segmentation: The Different Types of Spectrometers and Their Demand
The spectrometer market divides into three primary categories, each serving distinct analytical needs:
1. Mass Spectrometry
- Holds 45% market share
- Used in proteomics research
- Essential for drug development
- Popular in forensic analysis
2. Molecular Spectrometry
- Includes FTIR and Raman spectroscopy
- Dominant in materials science
- Critical for chemical structure analysis
- Rising demand in pharmaceutical quality control
3. Atomic Spectrometry
- Key player in elemental analysis
- Vital for environmental monitoring
- Used extensively in mining operations
- Growing adoption in food safety testing
The demand patterns vary significantly across these segments. Mass spectrometry leads revenue generation due to its precision in pharmaceutical research. Molecular spectrometry sees rapid growth in emerging markets, particularly in industrial quality control applications. Atomic spectrometry maintains steady demand through environmental regulations and mining sector requirements.
Price points reflect these market dynamics:
- High-end mass spectrometers: $200,000-$1,000,000
- Mid-range molecular systems: $50,000-$200,000
- Basic atomic spectrometers: $10,000-$50,000
The market shows a clear shift toward hybrid systems combining multiple spectroscopic techniques, reflecting users’ needs for comprehensive analytical capabilities in a single instrument.
How Applications Are Shaping Spectrometer Market Dynamics
The various uses of spectrometers in different industries create unique market trends and drive technological advancements.
1. Pharmaceutical Sector
The pharmaceutical industry is the largest user of spectrometers, using these devices for:
- Drug development and validation
- Quality control processes
- Impurity detection
- Stability testing
2. Environmental Monitoring
Environmental monitoring is an application area that is growing rapidly, with spectrometers being used for:
- Air quality assessment
- Water contamination detection
- Soil composition analysis
- Industrial emission control
3. Food and Beverage Industry
The food and beverage sector has adopted spectrometry for:
- Nutritional content verification
- Adulterant detection
- Quality assurance
- Shelf-life determination
4. Research Institutions
Research institutions are driving innovation through specific applications such as:
- Proteomics research
- Genomics studies
- Materials characterization
- Chemical structure determination
Each application sector has an impact on product development, pushing manufacturers to create specialized solutions. For example, the semiconductor industry requires highly accurate atomic spectrometers, while clinical diagnostics need fast, automated systems for high-volume screening.
The integration of spectrometers into production lines has created a demand for real-time monitoring capabilities, resulting in the development of inline spectrometry systems. This trend towards industrial automation is influencing product designs and features, especially in the automotive and electronics manufacturing sectors.
Regional Performance and Future Opportunities in Spectrometry
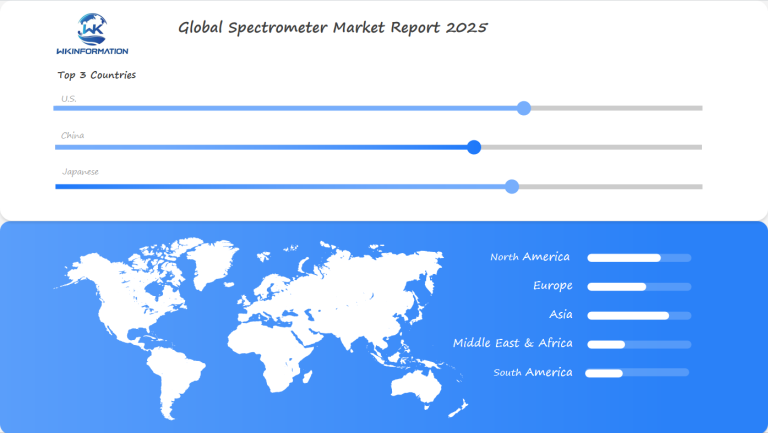
The spectrometer market displays distinct regional patterns, with each geographic area presenting unique growth trajectories and opportunities. North America currently commands a 50% market share, driven by established research infrastructure and substantial healthcare investments.
Asia-Pacific: A Region of Remarkable Growth Potential
The Asia-Pacific region demonstrates remarkable growth potential, with emerging economies investing heavily in:
- Research facilities
- Healthcare infrastructure
- Industrial quality control systems
- Environmental monitoring programs
Europe: Maintaining a Strong Position
Europe maintains a strong position through its focus on:
- Advanced pharmaceutical research
- Environmental protection initiatives
- Food safety regulations
- Industrial automation
Latin America and Africa: Promising Developments in Emerging Markets
Emerging markets in Latin America and Africa show promising developments in:
- Agricultural applications
- Mining industry implementations
- Environmental monitoring
- Healthcare diagnostics
Middle East: Increasing Demand for Spectrometry Solutions
The Middle East region exhibits increasing demand for spectrometry solutions in:
- Oil and gas analysis
- Water quality monitoring
- Pharmaceutical manufacturing
- Research institutions
These regional variations create diverse market opportunities, from high-end research equipment in developed markets to cost-effective solutions in emerging economies. The growing focus on local manufacturing capabilities and technology transfer agreements shapes regional market dynamics, influencing investment patterns and technology adoption rates across different territories.
The U.S. Market: Innovations and Growth in Spectrometer Demand
The U.S. leads the world in spectrometer sales, thanks to its many research institutions and significant government funding. Top research centers such as MIT and Stanford University are constantly improving spectrometry technology through innovative research projects:
- MIT’s Spectroscopy Lab is developing advanced spectroscopic methods for detecting cancer and monitoring the environment.
- Stanford’s Mass Spectrometry Lab is working on new techniques for analyzing proteins and discovering drugs.
- Harvard’s Center for Advanced Scientific Computing is creating AI-powered tools for analyzing spectrometry data.
The National Institutes of Health (NIH) plays a crucial role in advancing spectrometer technology through strategic investments:
- $2.1 billion allocated to research projects utilizing mass spectrometry (2023)
- $500 million dedicated to developing new spectroscopic methods for disease diagnosis
- Partnership programs connecting academic institutions with private sector manufacturers
U.S. research facilities excel in these areas:
- Biomedical Applications
- Real-time tissue analysis during surgery
- Blood-based disease biomarker detection
- Protein structure determination
- Environmental Monitoring
- Advanced air quality analysis
- Water contamination detection
- Soil composition studies
Private sector collaboration amplifies these research efforts, with companies like Thermo Fisher Scientific and Agilent Technologies partnering with universities to commercialize new spectrometry technologies. These partnerships accelerate the transition from laboratory innovations to market-ready solutions, maintaining U.S. leadership in the global spectrometer market.
China's Role in Spectrometer Production and Expansion
China’s manufacturing capabilities in the spectrometer market have grown significantly, making it a key player in the production of commercial-grade laboratory instruments. Chinese manufacturers now offer a wide variety of spectrometers, such as:
- FTIR Spectrometers: Advanced models with high-resolution capabilities
- UV-Visible Spectrometers: Cost-effective solutions for academic research
- Atomic Absorption Spectrometers: Robust designs for industrial applications
- Bench-top Models: Compact units tailored for laboratory settings
Government Initiatives Driving Growth
The Chinese government’s “Made in China 2025” initiative has played a crucial role in the growth of spectrometer manufacturing. This strategic program provides significant funding to local manufacturers, allowing them to:
- Develop cutting-edge spectrometry technologies
- Improve product quality control systems
- Implement automated production processes
- Expand research and development facilities
Improvements in Product Specifications
Chinese manufacturers have made significant progress in enhancing their product specifications:
- Resolution: Matching international standards at ±0.01 nm
- Sensitivity: Enhanced detection limits down to parts per billion
- Stability: Improved baseline stability for longer operation periods
- Software Integration: Advanced data processing capabilities
Support for Local Companies
Local companies receive targeted support through various initiatives:
- Research grants for technology innovation
- Tax incentives for manufacturing upgrades
- Subsidies for quality certification
- Partnership programs with academic institutions
This strategic approach has enabled Chinese manufacturers to produce spectrometers with competitive features while keeping costs low. The combination of government support and manufacturing expertise positions China as an important hub in the global spectrometer supply chain, serving both domestic and international markets with increasingly advanced analytical instruments.
The Japanese Spectrometer Market: R&D and Industrial Adoption
Japan’s spectrometer sector stands out for its groundbreaking R&D initiatives in high-throughput detection systems. Research institutions like RIKEN and the National Institute of Advanced Industrial Science and Technology (AIST) have developed novel data acquisition methods that process sample volumes 40% faster than traditional systems while maintaining precise resolution levels.
Key R&D Achievements:
- Advanced photon detection technology enabling real-time molecular analysis
- Quantum-based spectroscopy systems for ultra-sensitive measurements
- Integration of robotics for automated sample handling
- Development of AI-powered data processing algorithms
Japanese manufacturers have pioneered compact spectrometer designs that deliver laboratory-grade accuracy in portable formats. These innovations stem from close collaboration between academic researchers and industry leaders like Shimadzu Corporation and HORIBA.
The industrial sector has rapidly adopted these advanced spectroscopy solutions across multiple applications:
Manufacturing Applications:
- Semiconductor production: In-line quality control for chip fabrication
- Automotive: Material composition verification during assembly
- Food safety: Real-time contaminant detection in production lines
- Pharmaceutical: Continuous monitoring of drug synthesis processes
Japanese companies have implemented smart factory solutions incorporating spectrometer systems for 24/7 quality control. These automated systems reduce human error and increase production efficiency by up to 35%.
The integration of IoT capabilities in Japanese spectrometers enables remote monitoring and predictive maintenance, reducing downtime in manufacturing facilities. This technology has proven particularly valuable in industries requiring strict quality control measures, such as electronics manufacturing and chemical processing.
Future Outlook: The Evolution of Spectrometer Technology
The spectrometer industry is about to undergo significant changes due to new technological advancements. Innovative strategies for optimizing optical design are redefining how instruments are built, leading to lower costs and greater portability.
Key Innovations on the Horizon:
1. Quantum-Enhanced Spectroscopy
- Integration of quantum sensors
- Enhanced detection sensitivity
- Reduced measurement time
2. AI-Powered Analysis Systems
- Real-time data interpretation
- Automated calibration
- Predictive maintenance capabilities
The emergence of lab-on-a-chip technologies represents a paradigm shift in spectrometer design. These integrated systems compress multiple analytical functions onto single microchip substrates, enabling:
- Simultaneous multi-analyte detection
- Minimal sample preparation requirements
- Reduced reagent consumption
- Faster analysis times
Miniaturization Trends
The push toward compact designs continues with:
- Smartphone-compatible spectrometers
- Wearable spectroscopic devices
- Handheld multi-sensor systems
Research teams are developing novel materials and fabrication techniques to enhance sensor sensitivity while reducing production costs. These advancements target accessibility for smaller laboratories and field applications.
The integration of smart manufacturing principles into spectrometer production promises customizable instruments tailored to specific industry needs. This approach combines:
- 3D-printed components
- Modular design architecture
- Cloud connectivity
- Remote calibration capabilities
These technological developments signal a transformation in analytical capabilities, pushing the boundaries of what’s possible in molecular analysis and material characterization.
Competitive Landscape: Market Leaders and Competitive Forces
The global spectrometer market is primarily dominated by major industry players, indicating a concentrated competitive structure.
Key Market Leaders:
1. Horiba —— Japan
2. Skyray Instrument —— China
3. WATERS —— United States
4. Bruker —— United States
5. Agilent Technologies —— United States
6. Danaher —— United States
7. Analytik Jena —— Germany
8. AMETEK (Spectro) —— United States
9. Focused Photonics Inc (FPI) —— China
10. Avantes —— Netherlands
Overall
| Report Metric | Details |
|---|---|
| Report Name | Global Spectrometer Market Report |
| Base Year | 2024 |
| Segment by Type |
|
| Segment by Application |
|
| Geographies Covered |
|
| Forecast units | USD million in value |
| Report coverage | Revenue and volume forecast, company share, competitive landscape, growth factors and trends |
The spectrometer market is expected to reach $16.5 billion by 2025, indicating a significant shift in analytical technology. Several key factors suggest ongoing growth:
- Technological Integration: AI and machine learning are continuously improving spectrometer functionality, increasing accuracy and efficiency.
- Regional Market Dynamics: The U.S. leads in research and development, China excels in manufacturing, and Japan applies spectrometry in various industries, creating a strong global ecosystem.
- Application Diversity: The use of spectrometry is expanding in pharmaceuticals, environmental testing, and quality control, contributing to market growth.
In the next five years, we can anticipate:
- More development of portable and miniaturized devices
- Increased focus on cloud-connected spectrometers
- Greater emphasis on sustainable manufacturing practices
- Closer integration with Internet of Things (IoT) and smart laboratory systems
These advancements, along with rising demand from developing countries and ongoing innovation from industry leaders, position the spectrometer industry for significant growth and technological progress beyond 2025.
Global Spectrometer Market Report (Can Read by Free sample) – Table of Contents
Chapter 1: Spectrometer Market Analysis Overview
- Competitive Forces Analysis (Porter’s Five Forces)
- Strategic Growth Assessment (Ansoff Matrix)
- Industry Value Chain Insights
- Regional Trends and Key Market Drivers
- SpectrometerMarket Segmentation Overview
Chapter 2: Competitive Landscape
- Global Spectrometer players and Regional Insights
- Key Players and Market Share Analysis
- Sales Trends of Leading Companies
- Year-on-Year Performance Insights
- Competitive Strategies and Market Positioning
- Key Differentiators and Strategic Moves
Chapter 3: Spectrometer Market Segmentation Analysis
- Key Data and Visual Insights
- Trends, Growth Rates, and Drivers
- Segment Dynamics and Insights
- Detailed Market Analysis by Segment
Chapter 4: Regional Market Performance
- Consumer Trends by Region
- Historical Data and Growth Forecasts
- Regional Growth Factors
- Economic, Demographic, and Technological Impacts
- Challenges and Opportunities in Key Regions
- Regional Trends and Market Shifts
- Key Cities and High-Demand Areas
Chapter 5: Spectrometer Emerging and Untapped Markets
- Growth Potential in Secondary Regions
- Trends, Challenges, and Opportunities
Chapter 6: Product and Application Segmentation
- Product Types and Innovation Trends
- Application-Based Market Insights
Chapter 7: Spectrometer Consumer Insights
- Demographics and Buying Behaviors
- Target Audience Profiles
Chapter 8: Key Findings and Recommendations
- Summary ofSpectrometer Market Insights
- Actionable Recommendations for Stakeholders
Access the study in MULTIPLEFORMATS
Didn’t find what you’re looking for?
TALK TO OUR ANALYST TEAM
Need something within your budget?
NO WORRIES! WE GOT YOU COVERED!
Call us on: +1-866-739-3133
Email: infor@wkinformation.com
What is the projected growth of the spectrometer market by 2025?
The spectrometer market is projected to grow to $16.5 billion by 2025, reflecting a significant global surge in demand.
What are the key factors influencing the supply chain dynamics in the spectrometer market?
Key upstream factors include raw material availability and manufacturing capabilities, while downstream effects impact end-users such as pharmaceuticals and environmental testing industries that rely heavily on spectrometers.
How are technological advancements impacting the spectrometer industry?
Recent advancements in spectroscopy, particularly mass spectrometry techniques, along with applications of AI and machine learning, are enhancing the efficiency and accuracy of spectrometers, driving market innovation.
What challenges does the spectrometer market currently face?
The spectrometer market faces challenges such as high competition, pricing pressures, and regulatory hurdles that can affect growth across different regions.
How do geopolitical factors influence the supply and demand for spectrometers?
Geopolitical tensions and trade disputes can significantly impact supply chains for spectrometers, affecting manufacturing and distribution due to specific trade policies.
What role do countries like the U.S., China, and Japan play in the global spectrometer market?
The U.S. leads in R&D investments for medical research using advanced analytical techniques. China is expanding its manufacturing capabilities for commercial-grade laboratory instruments, while Japan focuses on R&D and industrial adoption of innovative spectroscopy techniques for quality control across various sectors.
RECENT REPORTS
Our clients